Blushield EMF Protection Evidence
1. Live Blood Cell Analysis
The test below was on the blood of a male in his mid 30s, in constant exposure to high levels of EMFs. Like many people, he was in close proximity to electrical equipment all day and spent a lot of time with his phone, computers and game consoles. He also ate a very poor diet and did not exercise.
He was given a Tesla Portable to carry with him at all times, and a Tesla Plug-in was also installed at his home and place of work (24/7). No changes were made to his diet and exercise during the test period – from January 11th 2012 to March 14th 2012.
Blood Tests – BEFORE Blushield Tesla EMF Protection Devices
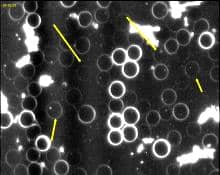 Parameter: Protein Linkage
Degree: Moderate
The red cells membranes are ghosting (exploding) due to their weakened state. Red cells are literally disappearing while being watched during live blood analysis.
Some of red blood cells are linked together by strands of sticky proteins, produced when the body is experiencing inflammation. This inflammation can be associated with infection, allergy, toxicity, poor digestion or unhealthy dietary choices.
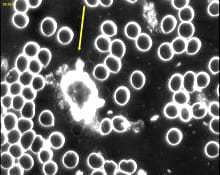 Parameter: Hypersecretory Platelets
Degree: Moderate
Platelets are small particles within your blood that are responsible for the clotting process.
Platelets can produce vesicles (bubbles) containing inflammatory chemicals. This can be a sign of prolonged low-level immune activation, often as a result of “leaky gut syndrome”.
There is a lot of parasite and crystallization taking place in the blood. Red cells are also bunched together and are of irregular shape.
Testers comment:
“High levels of inflammation and oxidation may relate to your lifestyle/occupation or diet.”
Cell Count (see normal ranges below)
- Neutrophils 55
- Lymphocytes 25
- Atypical Lymphocytes 1
- Monocytes 9 (out of normal range)
- Eosinophils 0
- Basophils 0
- Total Counted 90
Blood Tests – AFTER Blushield EMF Protection Devices
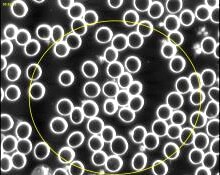 Parameter: Lymphocytes – atypical
Degree: Moderate
Within 2 months, the red cells have notably stronger membranes and fewer parasites.
Lymphocytes are a type of white blood cell, responsible for protecting the body against infection. Atypical lymphocytes have swollen membranes which may indicate they have been dealing with viral exposure.
Despite the subject having a cold there is a marked improvement in blood quality.
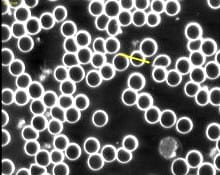 Parameter: Erythrocyte Aggregation
Degree: Mild
Crystallization has ceased and the red cells are of a more regular shape and distribution. A remarkable improvement despite no change in diet or lifestyle.
These blood cells are sticking to one another and forming clumps, due to being coated in sticky proteins. This is a sign that there may be inflammation happening in the body. This inflammation can be associated with infection, allergy, toxicity, poor digestion or unhealthy dietary choices.
Testers comment:
“Extremely reduced levels of inflammation and oxidation are amazing considering you have not changed your diet or lifestyle/occupation and had a cold.”
Cell Count:
- Neutrophils 61
- Band Cells 3
- Lymphocytes 15
- Atypical Lymphocytes 6
- Monocytes 16
- Eosinophils 1
- Basophils 0
- Total Counted 102
Neutrophils – normal range (55-65%)
Neutrophils are medium sized, silvery white blood cells. They are the “garbage collectors” of the immune system, patrolling your body, cleaning up debris and removing toxic or infective material.
Lymphocytes – normal range (20-30%)
Lymphocytes are small to medium sized dull white blood cells and are part of your immune defense system. They are particularly involved in fighting viral infections, and also certain bacterial infections.
Monocytes – elevated (>8%)
Monocytes are the “detectives” of the immune system, investigating any new intruders in the body. They engulf and process foreign material, alerting neutrophils and lymphocytes to the presence of infective agents and allergens. Their numbers may be increased during infection, especially at the very early stage before symptoms occur.
Eosinophils – normal range (0-4%)
Eosinophils are an important part of your immune system and may be increased when exposed to parasitic infection or allergies.
Basophils – normal range (0-1%)
Basophils are large white blood cells. They form part of the immune defense system, but are rarely seen in the blood.
Results of Testing
Lymphocytes went from 25 to 15, showing a normalization of the immune system. This is reflected in the blood. Obvious changes are apparent and the walls of the blood cells have normalized within a very short period of time. This was very noticeable, and very surprising to the tester.
References
CNN Report “Cell phone use can increase possible cancer risk”
The Straits Times article: “Call to ban cellphones and wireless networks in schools”
Rewireme Magazine articles on EMF and Hypersensitivity
Organization for the Advancement of Knowledge articles
2. Urine Analysis
To verify that Blushield technology caused decreased stress and increased organ function, a urine analysis performed on a diverse range of 10 people over 43 days. All have different stress levels and different lifestyles.
Urine tests accurately map organ function in percentile, enabling us to see if any change, positive or negative, has taken place. Tests were carried out before and after Blushield technology was used, to compare results.
After Blushield technology was used, urine was tested on the 3rd day, 13th and 43rd days respectively. Three test subjects were retired or semi-invalid, spending a longer period in the presence of Blushield technology. All other subjects spent less time exposed to Blushield technology. No subjects were undergoing any therapy at time of testing, nor were any on medications or drugs that would adversely affect results.
Results of the Urine testing clearly show that all persons undergoing the testing showed an increase in organ function, this shows a clear reduction in stress.
- Female 44 Non-smoker, average fitness, minor health complaints. 10% increase, less stress.
- Female 42 Nonsmoker, average fitness, very tired. 7% increase, more energy.
- Male 9 ADD child, moody, digestion problems. 16% increase, a lot less moody, less stress.
- Female 29 Nonsmoker, overweight, works in smoky environment. 10% increase, less stress.
- Female 16 Smoker, drinker, late nights, poor digestion. 2% increase despite unhealthy lifestyle, more energy.
- Male 47 Nonsmoker, poor digestion, on pain killers. 16% increase, immense improvement in stress levels despite condition.
- Female 40 Nonsmoker, asthma, low energy 27% increase, more energy, liver and circulation improved.
- Female 70 Nonsmoker, arthritic, liver and gall bladder conditions. 14% increase, improved stress levels and more energy.
- Female 53 Nonsmoker, average fitness, not active. 24% increase, significant decrease in stress.
- Male 66 Smoker, poor digestion, relatively fit. 38% increase, showed the most decrease in stress with the biggest improvement in digestion.
In the graphs below, you can clearly see the difference in test subjects both before and after. There is an obvious clear increase in organ function.
These results suggest not only does Blushield technology protect the body from dangerous EMF radiation, Blushield technology clearly improves the users stress levels and organ function.
Testing carried out by W McKenzie FMHI, Registered Natural Health Therapist.
3. Poultry Farm
The Blushield was used in a trial to determine how the Blushield would affect egg-laying chickens in an egg farm.
Use of the Blushield in Minnesota USA reported the adjacent hen house was being affected by the use of the Blushield in the barn for cattle etc. Turns out the hen house was producing twice as many eggs as per normal. This trial was carried out to prove this hypothesis.
The installation of a Blushield does directly affect stress levels of egg laying hens.
Method of Testing
The tests were carried out at a poultry farm in Te Puna situated on the outskirts of Tauranga, New Zealand.
The farm had two completely automated houses. One was selected as the Test House and the other as the control House. The breed of hen that was being tested was commonly known as a ‘Shaver’. The plug‐in Blushields were placed at 10-meter intervals and were switched on. The house had approximately 10,000‐15000 laying hens in at any one time.
We then took 5 hens in each given sector and carried out blood tests on them, noting such things as parasites, blood cell count and platelet shape and size. Also, the general health of the chicken was noted as to feather loss, weight, skin rashes and any other features that we felt relevant.
The weight of the eggs laid each day was averaged out with samples taken from each sector. The same applied to quantity, shell thickness and yolk quality. Blood tests were carried out at one month and three monthly intervals.
30 DAYS AFTER
RESULTS OF TESTS CARRIED OUT AFTER ONE MONTH
One month after starting the second blood tests were carried out again picking 5 chickens in each sector.
We found that the parasites that were current in the original blood samples had now virtually disappeared, the blood cell count had evened out, platelet size and shape remained the same. The general health of the hens appeared to be better all round and the hens were quieter and more docile to handle. The owner of the farm also made a comment that the noise level in number one house had dropped considerably since the installation of the devices.
MORTALITY RATE AFTER ONE MONTH
Before installation, the death rate in both houses had been approx. 60‐100 per month, in the weeks immediately after installation the death rate in-house one dropped to zero and rose to 4 & 6 respectfully in the following two weeks.
EGG QUALITY CHANGES AFTER ONE MONTH
The egg production before installation was between 74 and 78% of the total flock in-house one, after one month the average rose to between 82 and 84%. The yolk size and color had improved slightly; the color had changed and become a deeper yellow color. Eggs had increased in size by an average of 1mm. The shell appeared to be less fragile in nature although there was not any significant change in the thickness of the shell.
120 DAYS AFTER
RESULTS OF TESTS CARRIED OUT AFTER FOUR MONTHS
Health of the chickens appear to be at a constant level now, parasites appear to have been eradicated from the blood, cell count remains even and platelet size and shape remains regular.Mortality Rate after four months Deaths have declined to between 8 and 15 chickens per month in house one and appear to have levelled off so this is a significant gain.
EGG QUALITY CHANGES AFTER FOUR MONTHS
Egg production has now risen to between 84 and 87% of the total flock in house one. As old stock is culled at 80 weeks, new stock is brought in and egg quantities will vary over this period of change, also the egg sizes will vary as the pullets start laying. (Firstly they will lay smaller eggs) There has been a slight increase in yolk size on average. The egg size has risen overall, there are more 7 and jumbo eggs being produced (up about 10‐15%) The shell has definitely become stronger and less brittle.
365 DAYS AFTER
RESULTS OF TESTS CARRIED OUT AFTER ONE YEAR
Even though there were several changes in the flock during the year regards culling and new pullets being introduced, the blood samples taken, showed no signs of parasites returning. The general health of the hens remained at a good level with no signs of virus or skin diseases evident.
The noise levels were constantly lower at all times compared to the control house. The hens appeared to be more content in their environment and there was less pecking between hens. There was also a drop in the amount of food eaten by the chickens, yet the output in eggs and quality had increased. The appetite in the control house, however, remained the same.
MORTALITY RATE AFTER ONE YEAR
The mortality rate was the most significant factor of these tests. At no stage did they creep over the 25 per month and averaged out at about 16‐18 level, the hens appeared to have lost a lot of their aggressive nature and cannibalistic habits. This was a significant drop as at the start before the tests the mortality rate was from 60 to 100 chickens.
EGG QUALITY CHANGES AFTER ONE YEAR
Egg production rose to as high as 89% at times but ended up averaging between 84 and 87% which equates to a good 10% increase in production for the farmer. The quality of the eggs remained at a high level throughout with a consistent improvement in color of the yolk and better viscosity in the egg whites. The egg size definitely increased overall. The average egg weight went from 63 grams to 66 grams. The shell did not improve greatly in thickness; however, crack testing gave an indication that the shells were stronger.
SUMMARY
There were definitely some extremely good gains in egg production and the large drop off in mortality rates. When we add up the monetary gain from installing a Blushield the results show a significant return. Especially for an industry that works on small margins. A 10% increase in egg production appears to be the average over the testing period and the mortality rate fell from around 100 per month to an average of 17.
- Each laying hen is worth between $15 and $18 each, an average of $16.50
- Before testing 100 deaths at $16.50 = $1,650
- After Blushield 17 deaths at $16.50 = $280.50
- An overall savings in deaths alone of $1,369.50 per month!
- SAVINGS OF OVER $16,434 PER YEAR!
It was also evident that one of the longer term effects the Blushield will help with is the term of the hens laying life, which was extended out by as much as 20 weeks per hen. Egg size and quality of the eggs increased, larger eggs were laid compared to the control house.
It is clear that the Blushield has a significant effect on egg laying chickens. The poultry farm would be quickly able to reap the benefits and the Blushield would more than pay for itself within the first month, making future production more profitable and to also be of benefit to the hens in the hen house.
4. Dairy Cows
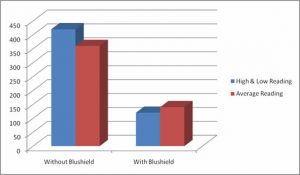
SOMATIC CELL COUNT TESTING IN DAIRY COWS (WHITE BLOOD CELLS IN MILK).
When the milk is received at the dairy processing plant it is automatically checked for the level of somatic cells present. All milk contains some level of somatic cells; the level of cells present is an indication of the quality of the milk and the health of the cows. Whenever a cow is subjected to stress, such as an injury or disease, the cell count rises. This is Mother Nature in action – white blood cells are created to fight off the stress.
We have monitored the somatic cell count in the entire milking herd for several months by alternating between the Blushield plugged in to the dairy barn and removed from the dairy barn. The results have been very consistent. The highest level reached without the Blushield has been 420, with the average reading at 360. The lowest reading with the Blushield plugged in to the dairy barn has been 120, with the average reading at 140.
Obviously the cows do not have cell count changes due to psychosomatic factors.
![[BLSHB1] B1 Premium Cube](/web/image/product.template/3033/image_1920/%5BBLSHB1%5D%20B1%20Premium%20Cube?unique=ae82545)
![[BLBH] Bundle: Blushield Home](/web/image/product.template/2384/image_1920/%5BBLBH%5D%20Bundle:%20Blushield%20Home?unique=ae82545)
![[BLBO] Bundle: Blushield Office](/web/image/product.template/2385/image_1920/%5BBLBO%5D%20Bundle:%20Blushield%20Office?unique=ae82545)
![[BLSHC1] C1 Ultimate Cube](/web/image/product.template/3061/image_1920/%5BBLSHC1%5D%20C1%20Ultimate%20Cube?unique=ae82545)
![[BLSHEVO] EVO Cube](/web/image/product.template/3140/image_1920/%5BBLSHEVO%5D%20EVO%20Cube?unique=ae82545)
![[BLP1] Phi Series Φ 1](/web/image/product.template/2441/image_1920/%5BBLP1%5D%20Phi%20Series%20%CE%A6%201?unique=7a6d2d3)
![[BLP2] Phi Series Φ 2](/web/image/product.template/2442/image_1920/%5BBLP2%5D%20Phi%20Series%20%CE%A6%202?unique=3e69565)
![[BLP3] Phi Series Φ 3](/web/image/product.template/2443/image_1920/%5BBLP3%5D%20Phi%20Series%20%CE%A6%203?unique=1f2da86)
![[BLSHT1] T1 Portable](/web/image/product.template/3454/image_1920/%5BBLSHT1%5D%20T1%20Portable?unique=ae82545)
![[BLSHPU] U2 Premium Ultra](/web/image/product.template/3485/image_1920/%5BBLSHPU%5D%20U2%20Premium%20Ultra?unique=ae82545)
![[BLW1] W1 Watch](/web/image/product.template/2459/image_1920/%5BBLW1%5D%20W1%20Watch?unique=3e69565)
![[BLX1] X1 Pendant](/web/image/product.template/2465/image_1920/%5BBLX1%5D%20X1%20Pendant?unique=7035973)